Client gave me one of those ‘just’ jobs. A dashboard graphic, that I thought I might have to get a colleague to do in javascript. Didn’t realise how easy it would be to do in native FileMaker.

In layout mode it’s 3 elements: a coloured bar, overlaid with a number of conditional ticks and a merge field with the actual percentage.
The multi coloured bar was just a rectangle, but instead of being filled with a solid colour I chose gradient and filled it like this…

The ticks were hidden with a range of calcs like this… Traffic_Light < 60 or Traffic_Light ≥ 70
I could have overlaid it with more ticks with smaller ranges. But <10. 10-20, 20-30 etc works great.

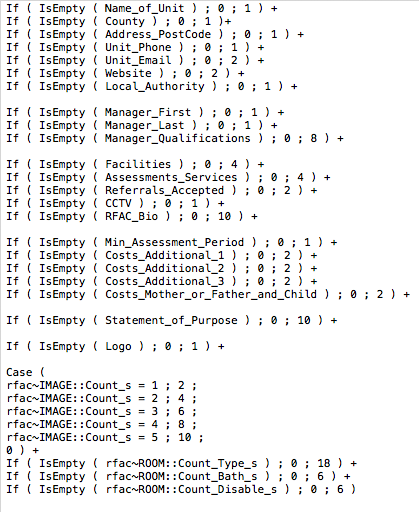
The last thing I had to do was the most time consuming. The client gave me a list of values against a range of fields that needed a value.